|
|
On 22 September, the winter maximum ice sheet extent across the Antarctic reached its greatest area since satellite measurement of the ice extent began in 1979 [1].
This is consistent with satellite lower tropospheric temperature data for the South Polar region at Dr Roy Spencer’s Web site [2] which reveals a slight but not statistically significant rate of cooling for the region for the 36 years of satellite measurement.
Coinciding with this, measurements of the atmospheric CO2 have been collected by NOAA at the South Pole and the data is available on the World Meteorological Organisation Web site [3]. It shows that the CO2 concentration has increased by 17.7% in the same period.
Confirmation of this disparity is available on the WMO Web site where measurements by CSIRO are provided for the CO2 concentration at the Antarctic stations of Casey [4] and Mawson [5]. Comparison of the CO2 concentration with the station’s average temperature data, available at the Bureau of Meteorology Web site [6], showed that both stations have experienced slight, -0.78 deg C per century at Casey and -1.43 deg C per century at Mawson, but not statistically significant cooling over the terms of the measurement. However the CO2 concentration has increased at Casey by 9% in 16.5 years and at Mawson 11.4% in 23 years.
These results are clear evidence that the IPCC proposition that increasing atmospheric CO2 concentration causes warming of the Earth’s surface is invalid. As the rate of increase of atmospheric CO2 has been much the same across the whole of the globe, the above puts paid to the CO2 – global warming fraud.
Sources:
[1] http://nsidc.org/arcticseaicenews/2014/10/2014-melt-season-in-review/
[2] http://www.nsstc.uah.edu/data/msu/t2lt/uahncdc_lt_5.6.txt
[3] http://ds.data.jma.go.jp/gmd/wdcgg/pub/data/current/co2/monthly/spo789s00.noaa.as.fl.co2.nl.mo.dat
[4] http://ds.data.jma.go.jp/gmd/wdcgg/pub/data/current/co2/monthly/cya766s00.csiro.as.fl.co2.nl.mo.dat
[5] http://ds.data.jma.go.jp/gmd/wdcgg/pub/data/current/co2/monthly/maa767s00.csiro.as.fl.co2.nl.mo.dat
[6] http://www.bom.gov.au/climate/data/?ref=ftr [Direct links: Casey; Mawson; use the “All years of data” link at the top right to download a ZIP file.]
Bevan Dockery, B.Sc.(Hons), Grad. Dip. Computing, retired geophysicist.
Formerly:
Fellow of the Australian Institute of Geoscientists,
Member of the Australian Society of Exploration Geophysicists,
Member of the Society of Exploration Geophysicists,
Member of the European Association of Exploration Geophysicists,
Member of the Australian Institute of Mining and Metallurgy.
November 15th, 2014 |
Categories: CO2 Greenhouse Science |
The Labor/Green coalition in Australia has declared war on coal, oil and gas and industries that use them. So why is Big Mining not fighting back?
BHP Billiton is a big producer of coal, oil, gas, iron ore, copper, nickel and uranium. Rio Tinto is a big producer of uranium, coal, iron ore, copper and aluminium. Glencore is a big producer of coal, copper, zinc and nickel. And Shell is big in oil, gas and bitumen, manufactures biofuels, and generates peak power with natural gas.
These companies employ competent geologists, physicists and chemists who could tell them that CO2 is not a pollutant, that it is not the primary driver of climate and that climate has been changing since time began. They must know there is no scientific justification for the green war on hydro-carbon fuels – but none of these big miners speak out against this baseless war on their products. UC Browser for Windows Some even waste shareholder funds producing glossy brochures promoting the green agenda – the BHP Billiton document “Climate Change: Portfolio Analysis” reads like it was produced by the Greens.
Big Mining is not that dumb. Their climate “concern” is more motivated by self-interest – they see long-term profits flowing from the silly green agenda. They are also political cowards wanting be loved by guilt-stricken billionaires, business haters from Hollywood and the green mob controlling the ABC/BBC.
Wind and solar power are indeed “free”, but to extract electricity from them is not free – it needs turbines and solar panels, generators and transformers, transmission towers and power lines – all of which boosts demand for metals like steel, copper, zinc, nickel and rare earths.
Moreover, wind and solar are very diffuse power sources and need large areas of land together with webs of access roads and power lines in order to collect significant power. The heavy machinery needed for construction, maintenance and replacements in these green power networks provide ongoing demands for petroleum and mining products. Before one watt of green electricity is generated for consumers, green power has boosted demand for most products of Big Mining.

Permission to use the cartoon is granted providing the source www.carbon-sense.com is mentioned.
To download a tif file of the cartoon (1.6 MM) click:
http://carbon-sense.com/wp-content/uploads/2016/12/flogging-green-horse.tif
Green power also needs back-up power ready to swing into action immediately the wind drops (or blows a gale) or clouds, fog, snow, rain, dust or night-time obscure the sun. This is great news for reliable energy suppliers capable of rapid backup, which usually means gas. Happy New Year 2018 Quotes So Big Gas loves Big Green – it is secretly delighted by the war on coal and the force-feeding of Green energy, as this will cause a boom in gas demand. Lead, nickel, cadmium and lithium miners are also delighted with the soaring demand for energy-storing batteries.
(more…)
December 17th, 2016 |
Categories: Electric Cars, Newsletters, Pollution, Wind Power |
OPEN LETTER TO THE PRIME MINISTER, AND TO THE LEADER OF THE OPPOSITION.
We are a group of retired scientists and engineers in Queensland, and we are alarmed at the direction our country is being taken through your respective policies, which are virtually identical, on renewable energy. Our names are listed here. We have studied this issue for years now, and we have here outlined the serious defects in your energy policy, and asked some questions which have thus far remained unanswered.
Energy Policy. By far the greatest risk to Australia’s electricity supply is the false belief that renewables (wind and solar) can be a like-for-like replacement for dispatchable fossil fuelled generators. They are not, and can never be. A one-MW wind or solar plant does not replace a one-MW coal plant. Not even close. Solar plants will produce electricity on average at 20% of their installed capacity. They produce power for little more than eight hours per day and none at all at night or on rainy days. Wind plants can be expected to produce electricity on average 25% to 30% of installed capacity, but output can be as little as 2% or as much as 70% with little warning.
Media reports in June this year referred to a “wind drought” across Southern Australia resulting in wind production being “40% below the previous corresponding period”. This is a problem but masks an even more intractable false belief; that an energy grid can run on averages. It can’t, because energy consumed has to be generated in real time. Just one example of that wind drought: at 2.20 PM on 5 th May this year, all the wind farms in Australia (4400 MW installed capacity in WA, SA, Vic, Tas and NSW) were producing just 121MW. (That’s 4400 MW capacity generating only 121MW). In fact for May and June this year this was not uncommon. Large high pressure systems over southern Australia meant little or no wind for weeks at a time.
The grid has to meet demand every minute of every day. AEMO can and does order fossil fuelled plants to produce electricity. Clearly it cannot do so for wind or solar. Just imagine Australia with a largely renewable energy system — it is night time so no solar power is being generated, and the whole of Southern Australia is dominated by high pressure systems (this is not unusual) and wind is producing at only 2% of installed capacity! To date dispatchable fossil fuelled generators have been able to shoulder the load but as dispatchable capacity is retired this may no longer be possible, with disastrous consequences.
On the face of it the answer is storage, either battery, pumped hydro or molten salt. This brings us to the next false belief; that storage is some sort of magic pudding. The capacity of current storage technologies is miniscule compared with daily demand. Australian grid demand varies between 18,000 MW minimum and 30,000 MW maximum. Over 24 hours this works out to about 600,000 MWh per day. The Tesla battery being installed in South Australia is said to be the world’s largest and to hold 129 MWh fully charged. This may be enough to support the local grid for a short time until dispatchable capacity can be started, but an unimaginable number of Tesla batteries would be necessary to maintain grid supply for a day or a week, or even longer in the worst case.
(more…)
October 13th, 2017 |
Categories: Letters, Renewable Energy Targets |

Many on the alarmist side of the climate debate seem to struggle to find rational arguments or evidence to support their cause so they usually resort to character assassination or defamation. A common attack on me is “Viv Forbes is just a coal industry stooge.”
This was put to the test recently at the year’s biggest Mining Industry function – the Queensland Resources Council Annual Forum and Lunch. The delegates on stage at the forum included very senior managers from BHP Billiton, Shell, Anglo-American, Peabody and Glencore. The audience was invited to ask questions.
I asked why people who employed many competent geologists, physicists and chemists never questioned the science behind the global warming scare.
NOT ONE INDUSTRY FIGURE ANSWERED, and the compère quickly moved on.
This is how the Courier Mail reported it:
“YOU might say mining industry figure Viv Forbes was the proverbial fly in the ointment at the Queensland Resources Council “state of the sector” forum in Brisbane on Wednesday.
The climate change denier got a cold response from a panel of industry high flyers when he asked why none of them questioned the science behind global warming “hysteria”.
Indeed, there was an awkward silence before the group, including top guns from Glencore and Shell, quickly moved on.
Forbes, who serves on the board of Brisbane-based Stanmore Coal, chairs a group known as the “Carbon Sense Coalition” and backs “Clexit,” an exit from climate treaties.xposed modules 2017
Just this week he reiterated his call “to defund all CSIRO global warming activities” and slammed “research puppets on the UN man-made global warming agenda”.”
Just for the record, I am no longer a director of Stanmore Coal, and receive zero income from the coal industry. I still hold shares in Stanmore coal, a coking coal producer and exporter.
Viv Forbes
[Click the image for a larger view, and to read more.]
January 21st, 2017 |
Categories: The Carbon Sense Coalition |
Dr David Evans
BSc, BE-EE, MA (Sydney), MS-EE, MS-Stat, PhD EE (Stanford)
[A slightly shorter version of this article appeared in The Australian newspaper on Friday 18 July 2008.]
I devoted six years to carbon accounting, building models for the Australian Greenhouse Office. I am the rocket scientist who wrote the carbon accounting model (FullCAM) that measures Australia’s compliance with the Kyoto Protocol, in the land use change and forestry sector. FullCAM models carbon flows in plants, mulch, debris, soils and agricultural products, using inputs such as climate data, plant physiology, and satellite data. I’ve been following the global warming debate closely for years.
(more…)
July 20th, 2008 |
Categories: The Evidence |
Ian McClintock
The impacts on agriculture of the CPRS1 in its present form, will be many facetted with major, minor, direct, indirect and subtle effects.
A decision is to be made in 2013 about including agriculture as a ‘covered sector’ in 2015. The Government is ‘disposed’ to include agriculture, which means that it is very likely to be included, and will then become subject to obtaining/buying Carbon Credits, or as they are to be known under the CPRS, Australian Emission Units (AEU’s) to cover the emissions that are calculated as being emitted.
Some AEU’s may be initially given to farmers, or may have to be purchased at auction, or at a fixed price determined by the government.
In any event it is proposed to reduce the number of AEU’s regularly (such as annually) to reduce Australia’s total emissions to meet the target it has set in the CPRS by 2020 and 2050.
The implications of this decision will be costly and dramatic.
More in the full document here. [PDF, 29KB]
July 18th, 2009 |
Categories: Policy Issues |
Philip Wood has a degree in Arts Law, experience in international finance, is an ex-merchant banker and now Managing Director of a minerals processing and industrial waste recycling company.
Companies like this are depend heavily on reliable cheap energy, which has led Philip and his team become directly interested in the science, economics and politics of alleged man-made climate change, a hypothesis that increasingly burdens the energy sector. In so doing, Philip has become deeply doubtful of today’s regular doomsday headlines and futile expensive solutions to the non-existent problem of global warming.
For a series of dramatic graphs that cover all aspects of the climate debate, see, copy and spread around this presentation by Philip: http://carbon-sense.com/wp-content/uploads/2011/06/a-cool-look-at-global-warming.pdf [PDF, 3.7 MB]
June 2nd, 2011 |
Categories: CO2 Greenhouse Science, The Evidence |
by Mark Imisides
December 7, 2009
Scarcely a day goes by without us being warned of coastal inundation by rising seas due to global warming.
Carbon dioxide, we are told, traps heat that has been irradiated by the oceans, and this warms the oceans and melts the polar ice caps. While this seems a plausible proposition at first glance, when one actually examines it closely a major flaw emerges.
In a nutshell, water takes a lot of energy to heat up, and air doesn’t contain much. In fact, on a volume/volume basis, the ratio of heat capacities is about 3300 to 1. This means that to heat 1 litre of water by 1˚C it would take 3300 litres of air that was 2˚C hotter, or 1 litre of air that was about 3300˚C hotter!
This shouldn’t surprise anyone. If you ran a cold bath and then tried to heat it by putting a dozen heaters in the room, does anyone believe that the water would ever get hot?
(more…)
December 19th, 2009 |
Categories: The Carbon Sense Coalition |
“The farming sector will still pay more for inputs such as fertilizer,electricity,fuel and transport and because they have always been price takers you can guarantee ETS charges levied on food processors will end up being paid by the farmer.
“Exempting agriculture is like being thrown from a 10th floor window instead of a 20th floor window – the result is the same.”
Senator John Williams, Senator for NSW, Nov 2009.
November 30th, 2009 |
Categories: Emissions Trading, Quotes |
Sadly, following the example of our dear leader, lying is becoming an art form in our over-governed country as the power freaks seek to add even more layers of taxation and regulation over our lives.
Even photographic images are manipulated to hide the truth and promote the lie.
Every time the new carbon tax is mentioned on ABC and SBS television, the word dioxide is as invisible as the gas itself.
But what is visible, and which looms large in the background to every story, are billowing white clouds coming from the towers.
But carbon dioxide is invisible. So all we can see must be smoke or water vapour, neither of which comprise the dreaded carbon dioxide.
In the news following the PM’s courageous attempt to maintain her steady-as-she-sinks course, a brief glimpse of Australia’s dirtiest power station, Loy Yang, showed the station’s magnificent smoke stacks in all their glory, but not a sign of any smoke. So the next close-up was carefully framed to show only the chimneys to the top of the structures – can’t have people asking why there were no visible emissions.
The only people supporting a carbon (dioxide) tax must be the lounge lizards glued to the deceptive images on their screens. They should walk out into the fresh air and hop on their bikes to visit these unfairly maligned energy supply installations and take note of the clear skies above and the verdant foliage flourishing and feeding from the abundant carbon dioxide plant food which is emitted from these wonderful structures.
John McRobert BE (Civ)
Brisbane Qld Australia
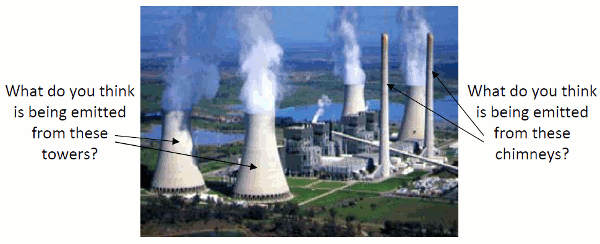
Read on for the answer: http://carbon-sense.com/wp-content/uploads/2011/07/coal-story.pdf’ [PDF, 90 KB]
July 31st, 2011 |
Categories: CO2 Greenhouse Science |
« Previous Page — Next Page »
|


 RSS
RSS
