|
|
January 20th, 2009 |
Categories: Ethanol, Humour |
New Zealand’s National Institute of Water & Atmospheric Research (NIWA) is responsible for New Zealand’s National Climate Database. This database, available online, holds all New Zealand’s climate data, including temperature readings, since the 1850s. Anybody can go and get the data for free. That was done by the New Zealand Climate Science Coalition (http://nzclimatescience.net/) and reported in a recent paper edited by Richard Treadgold.
They found that the raw data, when plotted, showed that New Zealand average temperatures have been remarkably constant, way back to the 1850’s. But the official graph produced by NIWA and provided to the IPCC showed significant “global warming” because the original data has been adjusted and strangely most of the adjustments create the warming trend. The NZCSC paper comments:
“We have discovered that the warming in New Zealand over the past 156 years was indeed man-made, but it had nothing to do with emissions of CO2-it was created by man-made adjustments of the temperature. It’s a disgrace.”
In an interesting coincidence, the original graph was prepared by Dr Jim Salinger when he worked at the Climate Research Institute at the University of East Anglia, which is now the centre of much attention because of what appears to be “adjustments” to CRU data and reports.
For the full article see:
http://nzclimatescience.net/images/PDFs/global_warming_nz2.pdf [PDF, 487 KB]
November 27th, 2009 |
Categories: Natural Climate Change, The Evidence |
By Dr. John Happs

The Greenland ice sheet is the second largest body of ice on Earth after the Antarctic ice sheet and to say that Greenland’s ice sheet is big would be an understatement. It is about 2,400 km long, 1,100 km wide and covers an area of around 1,710,000 square km. It has a volume of about 2,850,000 cu. km and ice cores have been taken from a depth of around 4 km.
The public read and hear only about Greenland’s short summer melting events with exaggerated media reports routinely providing alarmist messages. (more…)
April 9th, 2020 |
Categories: Greenland, Ice Sheets |
By Dr. John Happs
Venus is named after the ancient Roman Goddess of love and beauty, also called Aphrodite by the Ancient Greeks. Presumably, the “love and beauty” term came from the fact that Venus is the brightest of all the planets in the night sky.
The Italian Galileo Galilei (1564-1642) was the first astronomer to observe Venus through a telescope and he observed that the planet had phases like our Moon. This observation supported the revolutionary (and politically dangerous) idea that Venus and other planets orbited the Sun. (more…)
September 14th, 2020 |
Categories: CO2 Greenhouse Science, Venus |
- At most, global average sea level is rising at a rate equivalent to 2-3 inches per century. It is probably not rising at all.
- Sea level is measured both by tide gauges and, since 1992, by satellite altimetry. One of the keepers of the satellite record told Professor Mörner that the record had been interfered with to show sea level rising, because the raw data from the satellites showed no increase in global sea level at all.
- The raw data from the TOPEX/POSEIDON sea-level satellites, which operated from 1993-2000, shows a slight uptrend in sea level. However, after exclusion of the distorting effects of the Great El Niño Southern Oscillation of 1997/1998, a naturally-occurring event, the sea-level trend is zero.
- The GRACE gravitational-anomaly satellites are able to measure ocean mass, from which sea-level change can be directly calculated. The GRACE data show that sea level fell slightly from 2002-2007.
- These two distinct satellite systems, using very different measurement methods, produced raw data reaching identical conclusions: sea level is barely rising, if at all.
- Sea level is not rising at all in the Maldives, the Laccadives, Tuvalu, India, Bangladesh, French Guyana, Venice, Cuxhaven, Korsør, Saint Paul Island, Qatar, etc.
- In the Maldives, a group of Australian environmental scientists uprooted a 50-year-old tree by the shoreline, aiming to conceal the fact that its location indicated that sea level had not been rising. This is a further indication of political tampering with scientific evidence about sea level.
- Modelling is not a suitable method of determining global sea-level changes, since a proper evaluation depends upon detailed research in multiple locations with widely-differing characteristics. The true facts are to be found in nature itself.
- Since sea level is not rising, the chief ground of concern at the potential effects of anthropogenic “global warming” – that millions of shore-dwellers the world over may be displaced as the oceans expand – is baseless.
- We are facing a very grave, unethical “sea-level-gate”.
by Professor Nils-Axel Mörner
Read More here: http://scienceandpublicpolicy.org/images/stories/papers/reprint/sea_level_not_rising.pdf [PDF, 3.7MB]
June 24th, 2014 |
Categories: Sea Levels |
By Rocky Wood
Australian of the Year Tim Flannery attempted to scare the horses recently by baldly claiming greenhouse gases are now at levels far higher than has ever been publicly admitted before. Is this a cry of warning from an eco-warrior or yet another blast of climate-porn from one of the world’s leading climate pornographers?
Traditionally pornographers produce material their audience may regard as obscene, or at least titillating. Climate pornographers produce material that is obscene, regardless of your viewpoint – extremist, alarmist and designed to frighten regardless of the facts, or the reasonable conclusions to be drawn from the information to hand.
(more…)
October 14th, 2007 |
Categories: The Evidence |
Here is the latest Carbon Sense newsletter:
- Lord Monckton & Ian Plimer vs Graham Readfearn & Professor Barry Brook, Brisbane 29th Jan 2010
- The Climate is Changing
- Climate Madness and Electricity Realities
- Gore’s Books cause Warming in Britain
- Power Station Images – incompetence or propaganda?
Full newsletter is here: http://carbon-sense.com/wp-content/uploads/2010/01/climate-is-changing.pdf [PDF, 170 KB]
January 14th, 2010 |
Categories: Newsletters |
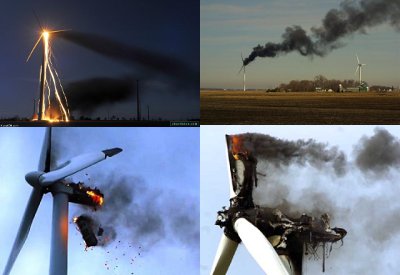
Some image of wind turbine failures.
More images here: http://carbon-sense.com/wp-content/uploads/2011/09/wind-turbine-failure.ppt [PowerPoint file, 483KB]
September 18th, 2011 |
Categories: Alternate Energy, Wind Power |
Climate Change, to say the least
makes us humans change some habits,
though the sun still chooses east
there is panic ‘mongst the rabbits.
Nerdy, idiosyncratic
motivation quite unknown,
quark and man made heavy static
new emperors to claim the throne.
Polar bears, so many starving
neither seals or tasty fish,
end up serving pups and carving
offspring as survival dish.
Icebergs melting raising oceans
though the physics are unclear,
grizzlies passing smaller motions
in the forests, so I hear.
Say the experts, it is gazzes
preference for C-O-Two,
emanating out of azzes
and the lowly Subaru.
Burning fossils is the trouble,
though we ought to, don’t you think?
And the atmospheric bubble
makes the solar system blink.
First it’s cooling then it’s warming,
records kept and falsified,
killer bees covertly swarming
turtles drowning in the tide.
Please dear reader, use some logic,
and recall your chemistry,
images so anagogic
for the biased mind to see.
They will plunge civilisation
into poverty and death
those who will commit their nation
to renounce their carbon breath.
All this is quite schizophrenic,
voices heard and faulty reason,
yet to say anthropogenic
is denial of the seasons.
Sun empowers living matter
sun has rhythm and design,
Gore the impotent mad hatter
claims his profit paradigm.
All in all, so many changes,
gone the cold Siberian East,
Santa carefully arranges
straw hats for his wildebeest.
©2009 Herbert Nehrlich
December 8th, 2009 |
Categories: Letters |
71% of the earth’s surface is covered by water and large areas of the land are covered by frozen water. Water and water vapour are also significant components of the atmosphere.
The atmosphere and its trace component of carbon dioxide is a very thin skin in close contact with the surface of all of this water. Carbon dioxide is very soluble in water and Henry’s Law says that as the temperature of water changes the quantity of carbon dioxide dissolved in that water will change.
Thus if the sea surface temperature increases, carbon dioxide will be expelled to the atmosphere just like carbon dioxide bubbles are expelled from a warming beer. And as sea surface temperature falls, carbon dioxide will dissolve in the cooling water and this reduces the carbon dioxide in the atmosphere.
This effect can be seen in seasonal, medium term and long term trends.
The seasonal variation in atmospheric content of carbon dioxide is well known, and the huge southern oceans are key players. See the short paper by Bob Beatty on the carbon dioxide cycle at : http://www.bosmin.com/HenrysLaw.pdf [PDF, 689 KB]
When it is winter in the southern hemisphere, the cold surface water of the oceans absorb carbon dioxide and the content of carbon dioxide in the air falls suddenly by about 4 ppm. This is reversed when the southern oceans warm in summer, and the carbon dioxide is expelled from the oceans. (The seasonal summer growth and winter fall of northern hemisphere vegetation adds to this seasonal fluctuation caused mainly by the southern oceans.)
On a medium time scale (21 year moving average) Professor Lance Endersbee published a short paper in August 2008 and he concluded that the oceans regulate the carbon dioxide in the atmosphere and the influence of human-generated carbon dioxide in the atmosphere is negligible. His paper included the following diagram:

See full article at: endersbee-co2-and-oceans.pdf [PDF, 490 KB; Source: ATSE No 151, August 2008.]
See also this paper by Alan MacRae: http://icecap.us/images/uploads/CO2vsTMacRae.pdf [PDF, 286 KB]
On longer time scales, ocean mixing caused by deep ocean currents causes long term changes in ocean temperatures. These changes also affect long term carbon dioxide trends. Carbon dioxide held in large quantities in cold deep ocean water is slowly released as ocean currents mix this cold water with warmer surface water. The reverse occurs as the sea surface cools, absorbs carbon dioxide and the cold dense water sinks to the ocean floor.
The most dramatic evidence of this lagged response comes from ice core data. These show that significant turning points in temperature precede the corresponding turning points in carbon dioxide content in air by between 650 and 1600 years.
See: http://carbon-sense.com/2009/10/03/taxing-ambulances/
Henry’s Law can and has been tested in laboratory experiments. The other data provides additional evidence for the conclusion that the major factor regulating carbon dioxide in the atmosphere, on all time scales, is the temperature of the oceans. Ocean temperature is controlled by solar cycles, cloud cover, ocean currents and undersea volcanism.
– Viv Forbes
December 29th, 2010 |
Categories: CO2 Greenhouse Science, Sea Levels |
« Previous Page — Next Page »
|


 RSS
RSS


